Amidst oil prices rebounding to $130/bbl. post-pandemic uncertainties ($40 to $60/bbl.), the oil and gas (O&G) industry embarks on a transformative journey. Mere management of oil price cycles is no longer viable. Over the upcoming 12 to 18 months, O&G strategists will focus on the advantages that Tableau offers:
- Revamping resource portfolios
- Enhancing energy transition plans
- Attracting and retaining top-tier talent
In this industry landscape, CRM analytics harnesses big data from various sources like customer interactions and transactions to decipher customer behavior. Tableau Desktop efficiently analyzes extensive datasets, while leveraging its advanced features for actionable insights. Tableau Public enables seamless public sharing, and Tableau Server ensures secure collaboration within the industry. Overall, Tableau’s suite empowers the oil and gas sector to leverage big data for CRM analytics, thereby augmenting customer relationships and fueling business growth.
The benefits of using CRM analytics for the oil and gas industry are as per below:
Transform resource portfolios
BP Energy Outlook 2020 and Shell Energy Transition Report 2020 project an oil demand of at least 87 million barrels per day by 2030. The current reliance on hydrocarbons and the green economy focus create a puzzling situation for O&G companies.
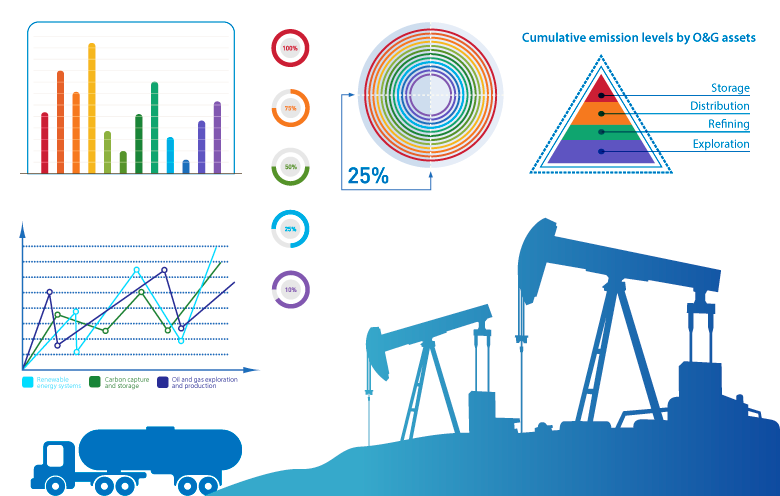
Hence, building a winning resource portfolio for O&G companies is more crucial than ever. Oil and gas exploration and production, gas-powered generation and transportation, carbon capture and storage, green hydrogen, and renewable energy systems are some of the options available. While companies recognize the need to change, competing for the remaining value in hydrocarbons (the traditional options) and embracing energy transition (the new opportunities) is not simple.
The green energy space needs massive capital. While the options of scaling and high growth are limited. So, O&G companies think carefully about portfolio optimization. KPIs monitoring is most important in developing a dynamic portfolio mix. That’s where CRM for oil and gas industry gives an edge.
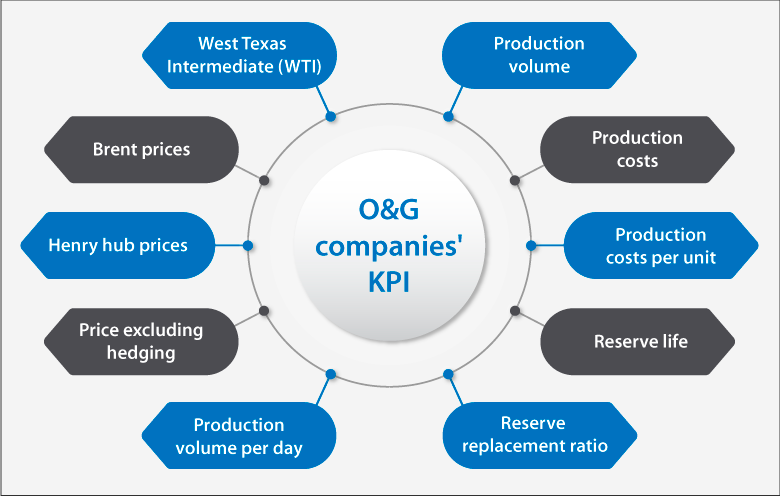
The following image shows some KPIs that Oil & Gas companies monitor regardless of the portfolio mix they make

Our Tableau experts are known for building customized data pipelines with required KPIs.
Boost energy transition plans
A high oil price encourages investment in more risky and costly green energy solutions, such as carbon capture, utilization and storage (CCUS). CCUS spans the entire value chain – from EPCI, oilfield services, upstream, midstream to downstream.
There are only about 20 commercial CCUS operations globally. Several factors can explain the slow adoption of CCUS. But high cost is the most frequently mentioned. With the governments’ announcement to commit $4.5 billion to develop 30 commercial CCUS facilities, the momentum is building.
Achieving net-zero goals is impossible without establishing CCUS. Can making informed decisions through CRM analytics help?
How Tableau oil and gas analytics enables net-zero goals

Using CRM analytics, any O&G company can analyze their emissions data and take measures to reduce its carbon footprint. Use the net zero analytics dashboard to learn about the emissions that your company’s exploration, development, production, transportation, storage, refining and distribution assets cause. Develop an action plan to achieve net-zero emissions based on these data-driven insights. The audit dashboard helps confirm the accuracy of your emissions data. It thus ensures the measures that your company implements are effective.
Other dashboards also come along with CRM analytics. The climate action dashboard provides carbon emissions data. It assists in devising a climate action plan to reduce emissions. Other is the business travel impact dashboard. It gives insights into effective measures a company can take to cut emissions from business travel. The waste management dashboard understands the carbon emissions caused by a company’s waste.
Here’s the roadmap of how CRM analytics can help

Note that the net zero analytics add-on license from the CRM analytics is a prerequisite.
Attract and retain skilled talent
A sharp plunge in oil prices in 2020 resulted in the fastest layoffs in the history of the O&G industry. Since then, oil prices have doubled. However, only about half of all lost jobs have returned. Talent competition is strengthening. How does the industry attract and retain skilled talent in the face of increased competition? The big question is how Tableau can help?
For instance, an O&G company is hiring subject matter experts (SMEs) for upstream, midstream or downstream operations. They need to spend significant time with data-related activities in their duties. Research suggests data professionals spend 75% of their time on data preparation tasks. That includes collecting and cleansing data. The rest is 25% in data analysis. What if this ratio flips? Using industrial Tableau dashboard, these SMEs do not need to deal with metadata management or data warehousing issues. Oil and gas data analytics dashboard by Tableau allows them to concentrate on their core skill set and amplify what they are good at. The payoff is SMEs give their best. They are now excited about career opportunities and what they can do to help the company’s bottom line. That’s what Tableau’s power is in attracting and retaining skilled talent.
Final words
The O&G industry rebounded strongly in 2021. An O&G company with purpose and tech enablement shape the path forward. With CRM analytics, influence the direction of your moves in 2022 and years ahead.
CRM analytics is not only for data visualization. Use it to transform resource portfolios, boost energy transition plans and attract and retain skilled talent. That’s how O&G industry achieves sustainable growth. Tableau is a CRM tool. And like all tools, its impact is in the hands of the user.


