Power BI is a business analytics tool developed by Microsoft that allows users to visualize and share insights from their data. It provides a user-friendly interface for creating interactive reports, dashboards and visualizations.
R, on the other hand, is a programming language and environment specifically designed for data analysis and statistical computing. It offers extensive libraries for data analysis, statistical modeling and visualization.
You can leverage the advanced analytical and statistical capabilities of R within your Power BI reports and visualizations. Integrating Power BI with R allows you to perform complex data transformations, statistical analysis and create custom visualizations using R scripts.
Benefits of Power BI integration with R
- Powerful data analysis: R is a powerful statistical programming language that can be used to perform a wide range of data analysis tasks, including statistical modeling, machine learning and data visualization. By integrating R with Power BI, users can take advantage of R’s capabilities to gain deeper insights from their data.
- Flexibility and customization: R is a flexible and customizable language that allows users to create custom solutions to meet their specific needs. This flexibility can be a major advantage for businesses that need to tailor their data analysis to their specific industry or use case.
- Ease of use: Power BI is a user-friendly platform that makes it easy to create interactive dashboards and reports. This makes it easy for business users to access and understand the insights generated by R.
- Collaboration: Power BI and R can be used to collaborate on data analysis projects. This can be beneficial for businesses that need to share data and insights across different teams or departments.
- Cost-effectiveness: R is a free and open-source language, which can save businesses money on data analysis software.
Power BI with R analytics integration
1. R Script Visual: Power BI allows you to create an R Script Visual that lets you write R code directly in Power BI. You can use this visual to perform complex data transformations, calculations and create custom visualizations using R scripts. This feature is especially useful when you need to apply specialized statistical methods or algorithms to your data.
2. R Custom Visual: Power BI provides a marketplace where you can find and use custom visuals created by the community. Some of these custom visuals are powered by R scripts, enabling you to create unique and advanced visualizations that may not be available through Power BI’s native visuals.
3. Data transformations: Power BI’s Power Query editor allows you to transform and shape your data before visualization. You can also use R scripts within Power Query to perform custom data transformations using R’s extensive libraries.
4. Advanced analytics: You can use R to perform advanced statistical analysis, predictive modeling and machine learning within Power BI. By combining Power BI’s data visualization capabilities with R’s analytical power, you can create more sophisticated and insightful reports and dashboards.
5. Machine learning: By leveraging R’s machine learning libraries, you can build predictive models within Power BI to make data-driven predictions and decisions.
To use R with Power BI, you need to have R and its tools for Visual Studio (RTVS) installed on your machine. Power BI Desktop integrates with R by default, allowing you to run R scripts directly within your Power BI projects. When you publish your Power BI reports to the Power BI Service, the R scripts will be executed there as well.
How to implement R analytics in Power BI
1. Enable R Scripting: In Power BI, go to “File” > “Options and settings” > “Options” > “R Scripting” to enable R scripting.
2. Add an R Script Visual: In your Power BI report, add an “R Script” visual. This visual allows you to enter R code and display the results as a visualization.
3. Write R code: Within the R Script visual, you can write R code using the provided editor. You can manipulate data frames, perform calculations and create visualizations using R packages.
4. Pass data to R: You can pass data from Power BI into R scripts using the “dataset” parameter. This allows you to use your Power BI data within your R code.
5. Visualize R outputs: The R Script visual will display the outputs generated by your R code as a visualization within your Power BI report.
It’s important to note that while R integration provides powerful capabilities, it might require some understanding of the R programming language and its libraries. Additionally, ensure that your Power BI environment has the necessary permissions to execute R scripts.
Keep in mind that the specifics of using Power BI with R might evolve over time with updates and new features. Always refer to the latest documentation and resources provided by Microsoft for the most accurate and up-to-date information.
Step-by-step guide to integrate R analytics with Power BI
In this example, we’ll create a Power BI report that uses R to perform some basic data analysis and visualization.
Scenario: We have a dataset containing information about sales transactions, and we want to use R to calculate the average transaction amount per month and create a line chart to visualize the trend.
Step 1: Data preparation
-Open Power BI Desktop.
-Load your dataset into Power BI using the “Home” tab and the “Get Data” option.
-Perform any necessary data transformations using the Power Query Editor. Ensure that you have columns representing transaction dates and transaction amounts.
Step 2: Integrate R Script Visual
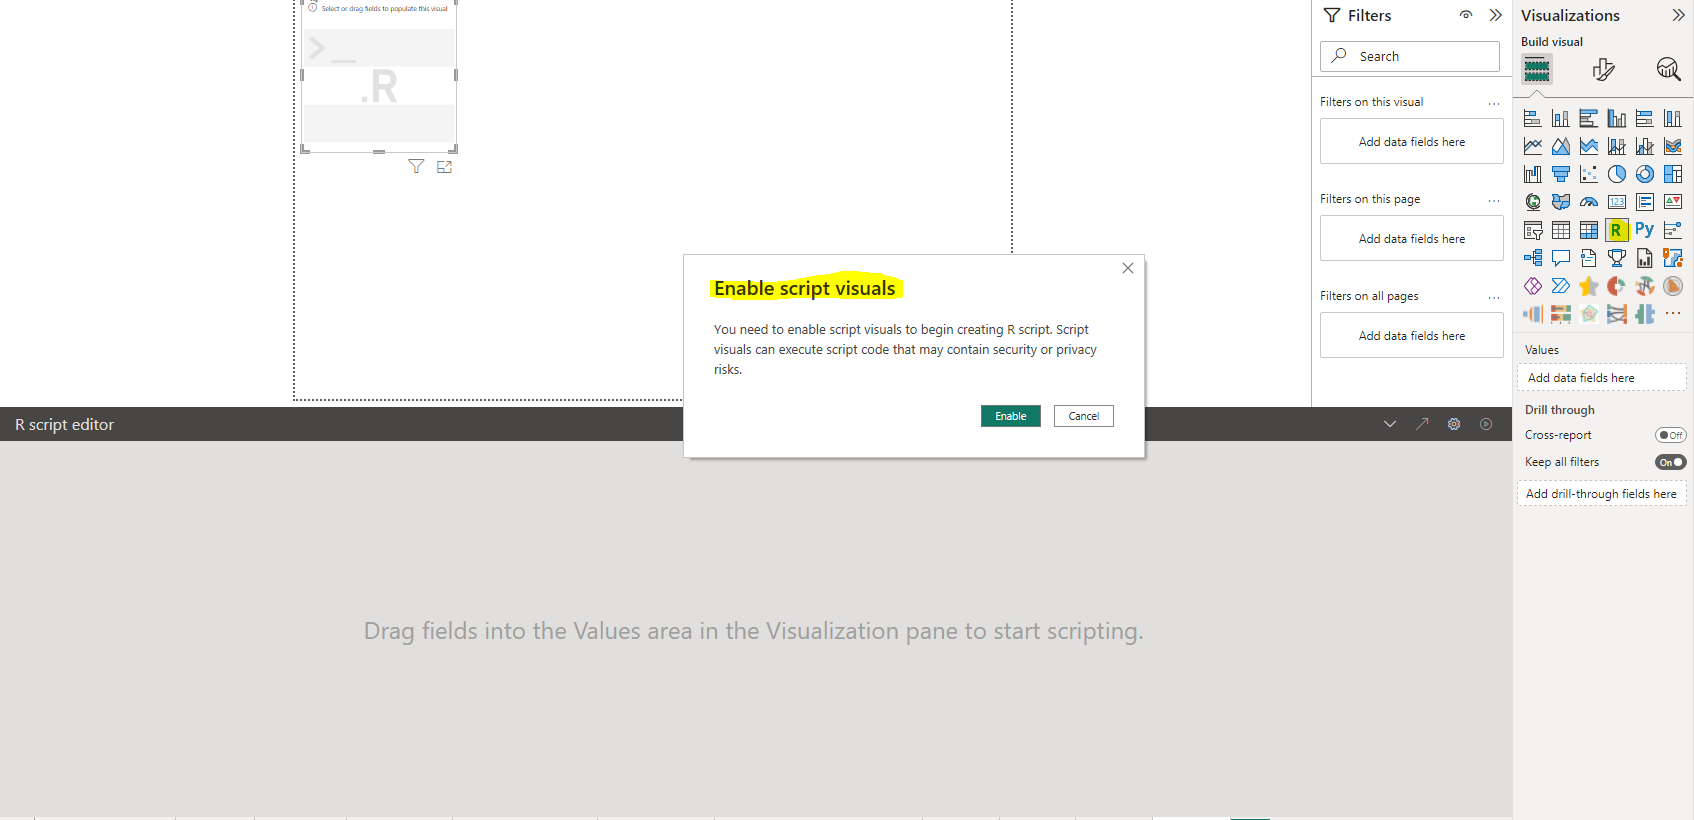
-In Power BI Desktop, go to the “Visualizations” pane.
-Choose the “R Script Visual” and add it to your report canvas.
– It will ask you enable script visuals. You can enable it by following steps listed above.
-Drag and drop the “Transaction Date” and “Transaction Amount” columns onto the “Values” field well of the R Script Visual.
-Click on the R Script Visual to open the R script editor.
Step 3: Write R Script
Replace the default R script with the following code:
# Load necessary libraries
library(dplyr)

# Convert Transaction Date to Date type
df <- df %>%
  mutate(TransactionDate = as.Date(TransactionDate))

# Group data by month and calculate average transaction amount
result <- df %>%
  group_by(Month = format(TransactionDate, "%Y-%m")) %>%
  summarize(AvgTransactionAmount = mean(TransactionAmount))
Result
This R script first loads the ‘dplyr’ library for data manipulation. It then converts the “Transaction Date” column to a Date type and groups the data by month, calculating the average transaction amount for each month.
Step 4: Visualize Results
-After writing the R script, click the “Run” button in the R script editor to execute the script.
-Once the script is executed, you’ll see a new table named “result” in the right panel.
-Drag and drop the “Month” column to the “Axis” field well and the “AvgTransactionAmount” column to the “Values” field well of a line chart visual.
Step 5: Customize Visualization
Customize the line chart as needed, adding titles, labels and adjusting the formatting.
Step 6: Save and Publish
Save your Power BI report and publish it to the Power BI Service if desired. The R script and the resulting visualizations will be available in the published report.
Conclusion
Implementing R analytics with Power BI enables you with actionable insights from your data. By combining the power of R’s statistical and machine learning capabilities with the ease of use of Power BI, companies can create interactive dashboards and reports that help them make more informed decisions.
If you are looking to take a step towards becoming a data-centric organization, talk to our data experts.
Co-author: Anshita Solanki


