Softweb’s data engineering efficiency fuels informed decisions for e-commerce giant
Click here to know more!Customer Background
A global leader in online retail, renowned for its vast selection of products, competitive pricing, and convenient delivery options. They offer a seamless experience across multiple platforms, including mobile apps and a user-friendly website. Committed to innovation, they constantly strive to personalize the customer journey and leverage cutting-edge technology to enhance logistics and fulfillment. With billions of customers worldwide, they are a dominant force in the e-commerce landscape.
Challenges
A leading e-commerce giant, renowned for its diverse product offerings and streaming services, faced significant challenges in utilizing data from a survey conducted by a leading research company. The existing system suffered from two main issues:
- Lengthy data delivery times hindered timely decision making for content acquisition and marketing strategies.
- The data format lacked accessibility and usability, making it difficult for the marketing team to effectively extract valuable insights for content development. This hindered their ability to understand audience preferences and tailor content offerings accordingly.
Solutions
Softweb Solutions partnered with the e-commerce giant to develop a new set of Tableau dashboards to address these challenges. The solution comprised the following key elements:
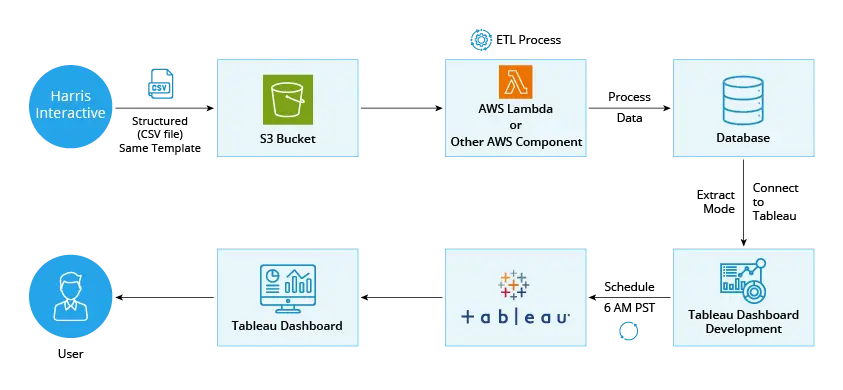
- Data integration and ETL: We streamlined the data flow by leveraging existing infrastructure, including the e-commerce giant’s cloud storage and data warehouse solutions. Our data engineers performed necessary ETL (extract, transform, load) processes to ensure data quality and prepare it for visualization in Tableau.
- Interactive Tableau dashboards: We designed two interactive dashboards:
- Dashboard 1: Global receptivity: This dashboard focuses on key metrics like pre-concept awareness, interest in content ideas, and likelihood to watch. Users could filter data based on various demographics, including label, title, age group, gender, and user status (registered or non-registered).
- Dashboard 2: Concept receptivity: This dashboard analyzes responses related to specific content concepts. It provided insights on intellectual property (IP) and talent awareness/appeal, descriptors and brand impact, and co-viewing interest. Similar filtering options were available for this dashboard.
- Automated data refresh: The dashboards are configured to automatically refresh data daily, ensuring the company always had access to the latest survey results.
Dashboard
-
Industry
-
Technologies / Platforms / Frameworks
Tableau, AWS
-
Benefits
- Reduced data delivery time
- Improved data accessibility and usability
- Data-driven content development
- Enhanced competitive advantage
- Optimized content investment
- Deeper audience insights
Decades of Trust & Experience

1630+
Projects

545+
Technocrats

26+
Products and Solutions

1020+
Customers
Similar Case Studies

Logi to Power BI migration cuts healthcare report time by 75%

How Softweb streamlined data operations for a leading energy company with Microsoft Fabric

Improving freight management with large language models
Connect Now
Our experts would be eager to hear you.


