Enhance your banking operations with insightful banking dashboards
Unlock the power of data for smarter banking
Get a DemoUnlock the power of data for smarter banking
Get a DemoOur Clients


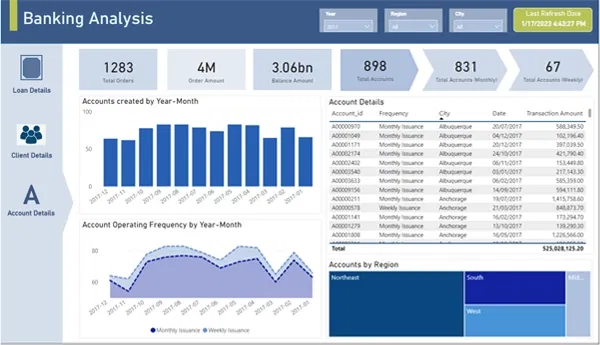
Banks leverage data analytics to gain valuable insights from financial data. It helps them make informed decisions and stay agile. Interactive banking dashboards and reports enable bankers to monitor key performance indicators, identify patterns, and make informed decisions driving profitability, risk mitigation, and customer satisfaction. With our expertise in data analytics in banking, our specialists help banks to gain valuable insights, optimize operational efficiency, identify trends, and make data-driven decisions.

Analyze branch-level profitability, identify underperforming branches and allocate resources effectively.
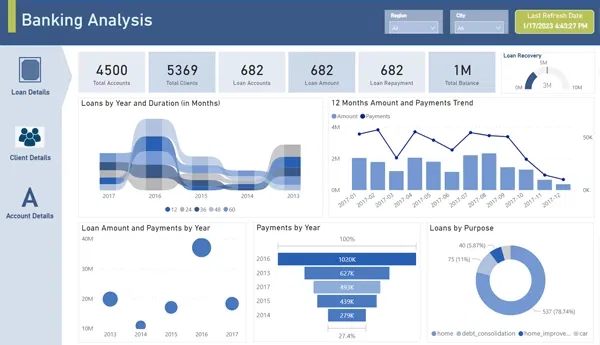
Track loan applications, approvals and delinquencies. Visualize loan performance metrics, such as the loan-to-value ratio, default rates and repayment patterns.

Track key risk indicators, assess compliance levels and ensure adherence to regulatory requirements. Identify potential compliance gaps and mitigate risks.
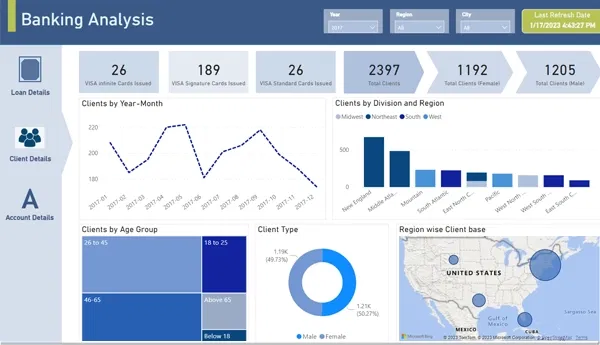
Gain insights into customer behavior, preferences and satisfaction levels. Track customer acquisition, retention and cross-selling opportunities. Visualize customer segments and analyze their profitability and lifetime value.
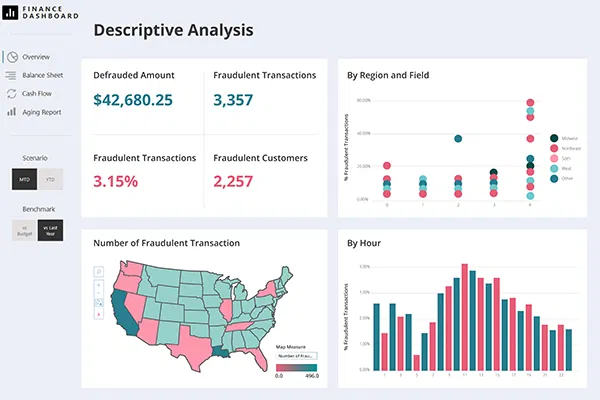
Monitor and detect suspicious activities, unusual transactions and potential fraud patterns. Identify anomalies and take prompt action to prevent financial losses.
Monitor cash positions, liquidity and investment portfolios. Visualize interest rate risks, foreign exchange exposures and market trends. Optimize treasury operations and make informed investment decisions.
Explore our innovative banking & financial dashboard
Explore data analytics opportunitiesSoftweb Solutions’ financial data analytics dashboards empower banking and financial institutions with valuable insights, informed decisions, and operational optimization. Advanced data visualization and analytics allow you to effectively track key performance indicators, identify trends, and analyze real-time financial data. Data visualization in banking enhances risk management, regulatory compliance, and profitability. Leverage interactive features, customized visualizations and seamless collaboration to unlock your data’s potential. This will enable you to stay ahead in the competitive banking and finance industry.

Get an overview of your financial and transactional data, extract meaningful insights, and make informed decisions based on the analysis.

Easily identify trends, patterns and anomalies in the data, which helps in strategic planning and decision-making.

Analyze and visualize the latest financial information. It enables you to understand your organization’s financial status and implement necessary adjustments when required.

Effectively manage risks with insights into risk exposures, potential vulnerabilities and regulatory compliance. Mitigate risks and ensure regulatory requirements.

Identify opportunities to optimize operations, reduce costs and drive profitability. Analyze financial data related to revenue, expenses and customer behavior.

Interactive features enable you to present financial data according to the requirement of your organization.

Share reports, charts and graphs that provide a clear understanding of financial performance, helping stakeholders make informed decisions.

Promote cross-functional collaboration, enhance teamwork, and achieve end-goals accessing financial data.
Propel your business forward with our expert data analytics guidance and support
 100% Secure. Zero Spam.
By submitting this form you agree with the terms and privacy policy of Softweb Solutions Inc.